Map example
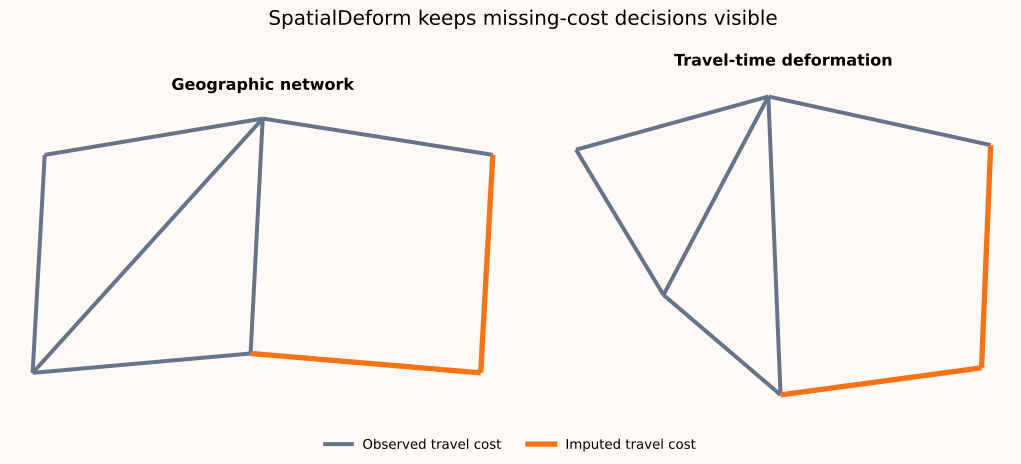
This example builds a small street network, resolves two missing segment travel times, and plots the geographic network beside its travel-time deformation. It is self-contained and does not download map tiles or data.
Run it
Clone the repository and run the checked-in example with the plotting extra:
The script writes docs/assets/map-example.svg. Its essential workflow is:
import numpy as np
from spatialdeform import SpatialDeformer

model = SpatialDeformer(
    cost="travel_time_s",
    missing_cost="median",
    impute_by="road_class",
    geo_weight=0.08,
)
deformed = model.fit_transform(edges)

status = np.where(model.edge_mask_, "observed", "dropped")
status[np.isin(edges.index, model.imputed_edges_)] = "imputed"
The complete data construction and plotting code is in
examples/map_example.py.
Read the result
The orange segments had no observed travel time. They remain visible and are used in fitting only after their values are resolved. Here the local-road segment receives the local-road median; the missing service-road group has no observations, so it receives the global median.
for edge_index in model.imputed_edges_:
    print(edge_index, model.costs_[edges.index.get_loc(edge_index)])
Keep that distinction in analytical exports too. The fitted audit attributes are aligned with the input rows:
| Attribute | Meaning |
|---|---|
costs_ |
resolved costs aligned with input; dropped positions stay missing |
edge_mask_ |
whether the row participated in graph fitting |
imputed_edges_ |
input index labels whose values were filled |
dropped_edges_ |
input index labels omitted from graph fitting |
n_edges_used_ |
number of graph-fitting edges |
Try another policy
Use missing_cost="length" with a speed in projected distance units per cost
unit, or missing_cost="drop" if the remaining network is still connected.
See Input data for policy details and
failure modes.